Explore
Featured
Recent
Articles
Topics
Login
Upload
Featured
Recent
Articles
Topics
Login
Upload
Search Results for 'effect chart'
effect chart published presentations and documents on DocSlides.
Pareto Chart QM 2017 2/1/2017
by brown
Lean Six Sigma. 1. What is Pareto Chart?. A . Pare...
Root Cause Analysis
by tatyana-admore
Agenda. Purpose. How it works. RCA at your shop. ...
Airline Operating Costs and Airline
by tawny-fly
Productivity: . Frontier Airlines. Danielle Hettm...
See Bellringer below Complete the cause and effect chart (from the short story)
by giovanna-bartolotta
see example. Complete the cause and effect chart....
Hypothesis test flow chart
by calandra-battersby
f. requency. data. Measurement . scale. n. umber ...
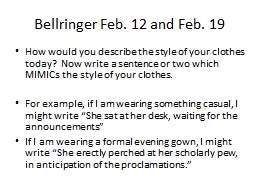
Bellringer Feb. 12 and Feb. 19
by natalia-silvester
How would you describe the style of your clothes ...
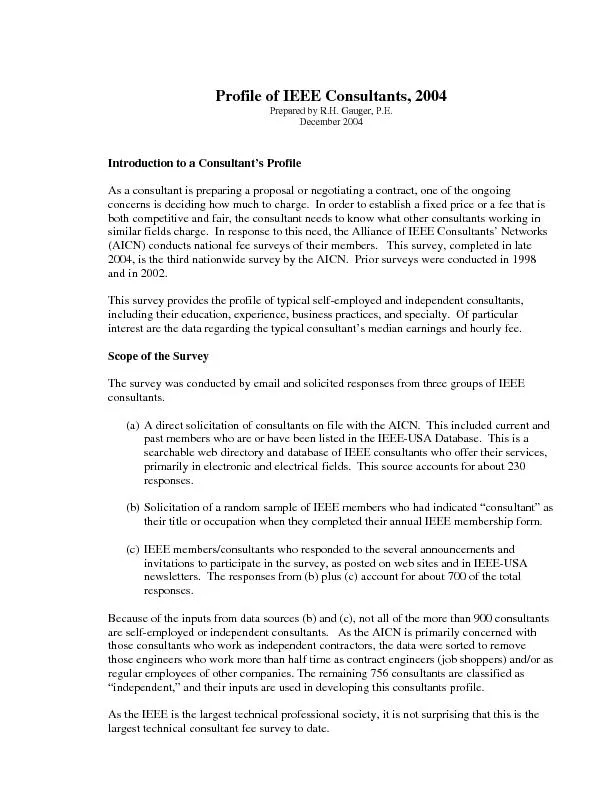
The next chart shows the effect of education on the consultant’s
by ellena-manuel
Gross Annual Income from Consulting vs. Education$...
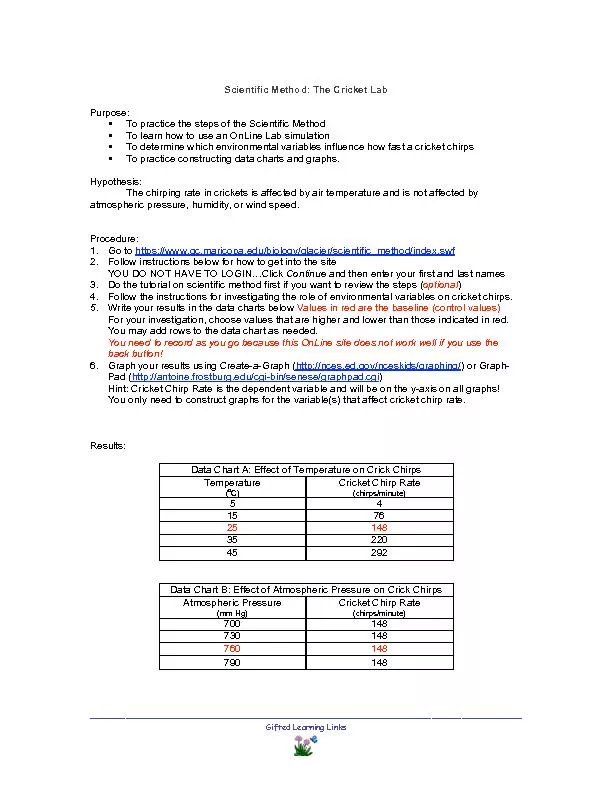
Results: Data Chart A: Effect of Tempera
by pasty-toler
148 6 148 the independent variable in comparison ...
Sensitivity Analysis
by mitsue-stanley
Jake Blanchard. Fall . 2010. Introduction. Sensit...
Load More...